Genotype vs Phenotype: What the Difference Is and How to Tell Them Apart
A clear guide to genotype vs phenotype: what each term means, what a photo can prove, common traps, and verification steps for student examples.
Quick answer: genotype vs phenotype in practice
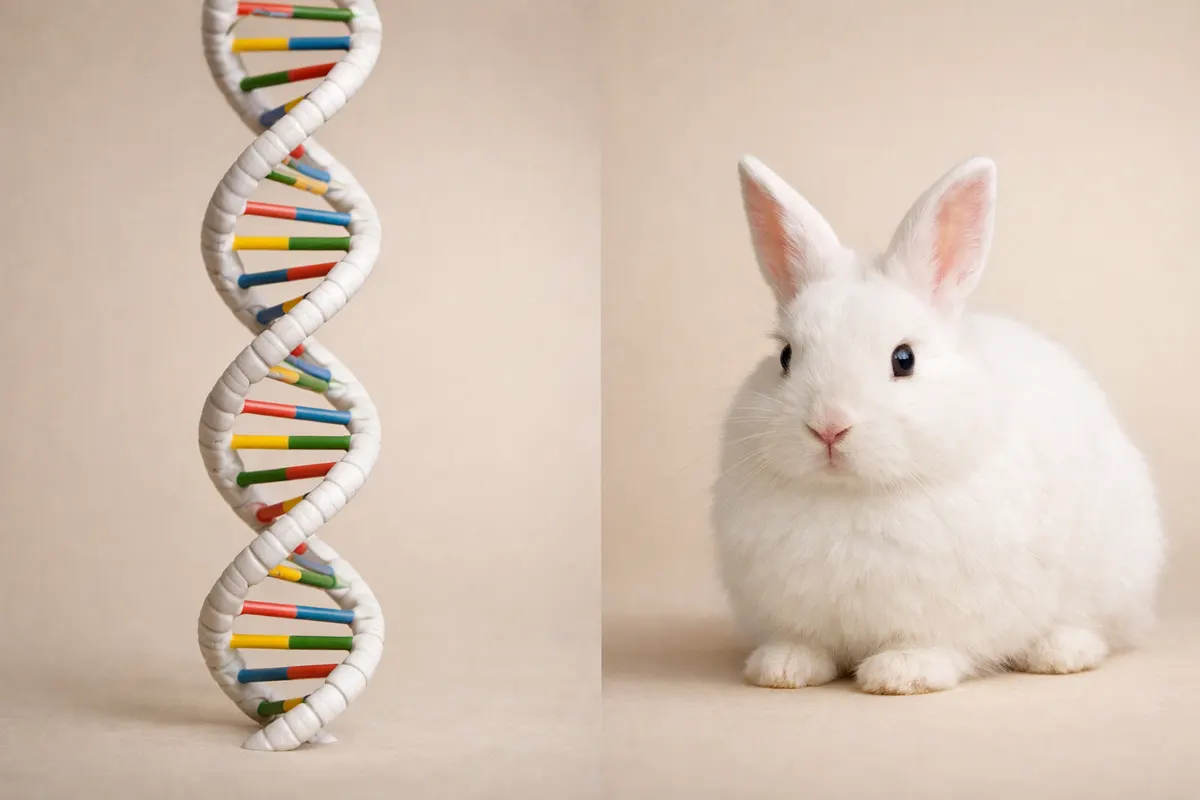
Genotype vs phenotype describes two different levels of biological description: the genotype is an organism’s genetic makeup (the alleles it carries), while the phenotype is the set of observable traits produced by that genotype plus environment. In short: genotype is the information; phenotype is what you actually see or measure.
A useful way to think about this for homework is: a Punnett square predicts possible genotypes; the phenotype is the trait you record in a cross (for example, purple or white flowers). When evaluating worked examples, always separate the genetic notation (Aa, AA, aa) from the observed trait outcome — one is a prediction from alleles, the other is the observed result.
Confidence differs: you can report a phenotype directly from observation (with known caveats), but inferring genotype from phenotype alone may be ambiguous because of dominance, incomplete dominance, epistasis, or environmental effects. That’s why verification steps matter when you report answers.
- Genotype = the alleles (e.g., AA, Aa, aa), the heritable information.
- Phenotype = the observable trait (e.g., purple flowers, tall plant, blood type).
- You can see phenotype directly; genotype often requires testing or deduction from crosses.
- Don’t conflate predicted genotypes in a Punnett square with the actual phenotype frequency in a sample.
Side-by-side: genotype vs phenotype comparison
This table summarizes what each concept tells you, how you can detect it, how confident you can be from quick checks, and the sensible next steps after you observe a result. Use it as a checklist when reviewing genetics homework or lab notes.
Below the table are short notes on reading the rows: look for whether evidence is direct observation (phenotype) or inferred/detected (genotype), and whether extra tests are needed to remove ambiguity.
| Feature | What genotype tells you | What phenotype shows | Typical confidence from a single observation |
|---|---|---|---|
| Visible trait | Possible allele combinations behind the trait | Color, height, shape, presence/absence | High for presence; low for underlying alleles without tests |
| Molecular evidence | Exact alleles if sequenced or genotyped | No direct info unless trait measured is molecular | Very high if done correctly |
| Dominance effects | Predicts allele interactions but not always expression | May mask recessive alleles (dominant phenotype visible) | Low confidence for recessives from phenotype alone |
| Environment influence | Alleles present regardless of environment (usually) | Trait expression may change with environment (nutrition, temp) | Phenotype confidence varies widely |
| Predicting progeny | Gives expected genotype ratios for crosses | Gives expected phenotype ratios after accounting for dominance | Probabilistic; need sample sizes to confirm |
- Direct observation is strongest for phenotype; genotype inference usually needs crosses, family data, or molecular tests.
- Ambiguity sources (dominance, pleiotropy, environment) are noted where a single phenotype could map to multiple genotypes.
genotype vs phenotype examples for common homework types
Different homework problems call for focusing on genotype or phenotype. If the question asks for expected allele ratios or the combinations that parents can produce, work with genotype notation (e.g., Aa × Aa → 1 AA : 2 Aa : 1 aa). If the prompt asks for expected trait counts or the appearance of offspring, translate those genotype ratios into phenotype ratios using the dominance rules given.
Concrete examples help. For a monohybrid cross where A is dominant: a cross of Aa × Aa yields genotype ratios 1 AA : 2 Aa : 1 aa, which typically corresponds to a 3:1 dominant:recessive phenotype ratio. For incomplete dominance (e.g., red × white → pink), genotype and phenotype ratios match because heterozygotes have an intermediate appearance.
When a problem includes more complex factors — epistasis, sex-linkage, or environmental effects — state each assumption explicitly. Write the genotype calculation first, then show how you mapped those genotypes to phenotypes so a grader can follow both your reasoning and your final counts.
- Monohybrid, complete dominance: use genotype notation first, then convert to phenotype counts.
- Incomplete dominance: genotype and phenotype ratios will often match; show the intermediate phenotype.
- Dihybrid crosses: use forked-line or Punnett square but keep genotype combos separate from phenotype mapping.
- When given observed offspring, use back-crosses or test crosses to deduce likely genotypes.
genotype and phenotype: why students mix them up
Students often treat genotype and phenotype as interchangeable because casual language uses “trait” for both. The root cause is that phenotype is the visible endpoint of genotype plus environment, so seeing a trait naturally leads to assuming the underlying alleles are known. That reasoning breaks down whenever dominance, incomplete dominance, or environmental modulation are available.
A particularly common trap is assuming a dominant phenotype must be homozygous dominant (AA). In many problems, Aa and AA both produce the dominant phenotype; you can’t tell them apart by appearance alone without additional crosses or tests. Another frequent error is failing to consider penetrance: sometimes a genotype doesn’t express the expected phenotype consistently.
Lookalike phenotypes cause errors: different alleles or even different genes can produce similar appearances (convergent phenotypes). For example, two unrelated mutations might both produce a white flower, yet their genotypes are distinct. Teaching students to separate the notation stage (listing genotypes) from the observation stage (recording phenotypes) prevents many grading mistakes.
- Mistake: calling Aa and AA ‘different phenotypes’ — they usually look the same under dominance.
- Mistake: treating a single observation as definitive evidence of genotype when sample size matters.
- Mistake: ignoring environment — temperature-sensitive alleles or nutrition can change phenotype.
- Good practice: always label which step produced the result (inference vs observation).
Verification path: what to confirm before you lock an answer
Before finalizing an answer that links genotype to phenotype, run a quick checklist: 1) Confirm the dominance relationships stated in the problem, 2) Recalculate genotype ratios using a Punnett square or probability rules, 3) Map those genotypes to phenotypes explicitly and show conversion, and 4) Note environmental caveats or additional genetic interactions the prompt mentions or omits.
If you’re inferring genotype from observed phenotype, consider what additional evidence would reduce ambiguity: a test cross (cross to a known homozygous recessive), family pedigree data, or a molecular test. In classroom settings, the appropriate verification is often a test cross or showing you understand why certain genotypes cannot be ruled out from a single phenotype.
When using images, photos, or quick observations, document the evidence quality: lighting and angle for visual traits, developmental stage (seedling vs mature plant), and whether the trait can be quantified (e.g., flower color measured by spectrophotometer vs described as “pale”). For example, a single photograph of a plant labeled “tall” is weak evidence — include measurement or a scale bar for stronger claims.
- Check dominance statements and assumptions before mapping genotypes to phenotypes.
- Use test crosses to distinguish heterozygotes from homozygotes when possible.
- Record sample size: genotype probabilities need adequate sample numbers before phenotype ratios are trusted.
- Annotate photos or observations with the conditions that could affect expression (temperature, age, nutrition).
Related guides
Check your worked genetics examples step by step
Use BiologyAI to walk through your Punnett squares and genotype-to-phenotype mappings one step at a time: upload your problem text or type the cross, show the assumptions you used, and get a guided review that highlights plausible alternative genotypes and where environmental or dominance effects could change the outcome. Treat the app’s feedback as a study aid — verify any final claims in class notes or with a test cross when accuracy matters.


Frequently asked questions
What is a genotype in a two-parent Punnett square example?
A genotype is the specific allele combination an individual carries — for Mendelian problems that means the letter pairs you write in Punnett squares (for instance, Aa, AA, or aa). In a two-parent Punnett square you list the parental gametes across the top and side, fill the four boxes with the resulting allele pairs, and those entries are the predicted genotypes for offspring. If the parents are Aa × Aa, the Punnett square predicts genotypes 1 AA : 2 Aa : 1 aa. Remember that these are expected proportions; actual offspring counts can vary by chance, so report both predicted ratios and sample sizes when applicable.
What is a phenotype when I'm describing observed offspring traits?
A phenotype is the trait you actually observe or measure in the organism, such as flower color, seed shape, or enzyme activity. When describing observed offspring, report the phenotype counts (for example, 75 purple : 25 white) and then show how you mapped those counts to predicted genotypes. Include any observational limits — if color grading was subjective or some individuals were scored at an immature stage, that reduces confidence in linking phenotype to genotype directly.
How can I create reliable genotype vs phenotype examples for studying?
To make dependable practice examples, pick a simple inheritance pattern and state all assumptions clearly: type of dominance, single-gene vs polygenic, and environmental controls. Start with a monohybrid cross (Aa × Aa) and produce both the Punnett square genotypes and the expected phenotype counts. Then vary one factor — change a parent to AA or make the trait incompletely dominant — and compare outcomes. Doing a small simulated dataset (e.g., 100 virtual offspring sampled from predicted probabilities) helps you see natural sampling variation and prevents overconfidence in a single theoretical ratio.
Why might a phenotype not reflect the expected genotype in lab observations?
Several reasons break the simple mapping: incomplete penetrance (a genotype sometimes doesn’t express), variable expressivity (expression strength varies), environmental modulation (temperature, nutrition, or stress), epistasis (other genes modifying the trait), or scoring errors in observation. When a phenotype differs from expectation, list possible biological causes and propose follow-up checks such as test crosses, larger sample sizes, or molecular genotyping to resolve which explanation fits the data best.